
Interactive Visualization of Board Game Play for Humans and AI
Motivation
Artificial Intelligence (AI) agents are achieving superhuman performance in many games. The strategies developed by such agents can be used to help human players improve their strategies. Moreover, interactive visualisation tools can help users understand complex AI strategies. To support this, we designed a recommendation-based visualization tool that board-game players and researchers can use while they are playing the game. The tool highlights both AI-generated and human strategies, where the AI-generated strategy is a pre-trained algorithm, while the human strategy is the most probable human move based on the collected data. Visualising both the AI agent and human strategies on the same board makes it easier for the user to understand and compare how different players—human or artificial—approach the game. We demonstrate the tool using Tic-Tac-Toe, a simple and highly interpretable setting that allows users to clearly see how the recommendations work.
Data
Existing Datasets
For the task of studying Tic-Tac-Toe moves, we found two publicly available datasets:
-
Tic-Tac-Toe Endgame Data Set [link]: This dataset contains information about multiple games. Each row in the dataset contains the final configuration of the board as well as labels of win and loss. The columns in this dataset are the 9 positions of the board and a final column of win/loss/draw. However, this dataset does not contain information about moves at each step of the game and, therefore, is not suitable for our analysis.
-
Tic-Tac-Toe Machine Learning dataset [link]: In this dataset, for each game, all moves made by the players are recorded along with the final result of the game (win/lost/draw). The columns show moves 1 to 7 and a final column indicating a win/loss/draw. However, the description of this dataset is incomplete. According to the description of the dataset, the game terminates after 3 up to 9 moves. However, the Tic-Tac-Toe game requires at least 5 moves for it to terminate (3 from the winner and 2 from the loser). Moreover, this dataset only contains 7 moves, whereas there are a total of 9 moves in the game of Tic-Tac-Toe. Therefore, this dataset is not suitable for our analysis.
This led us to collect our own dataset, for which we created a custom game engine, described in the following section.
Human Data
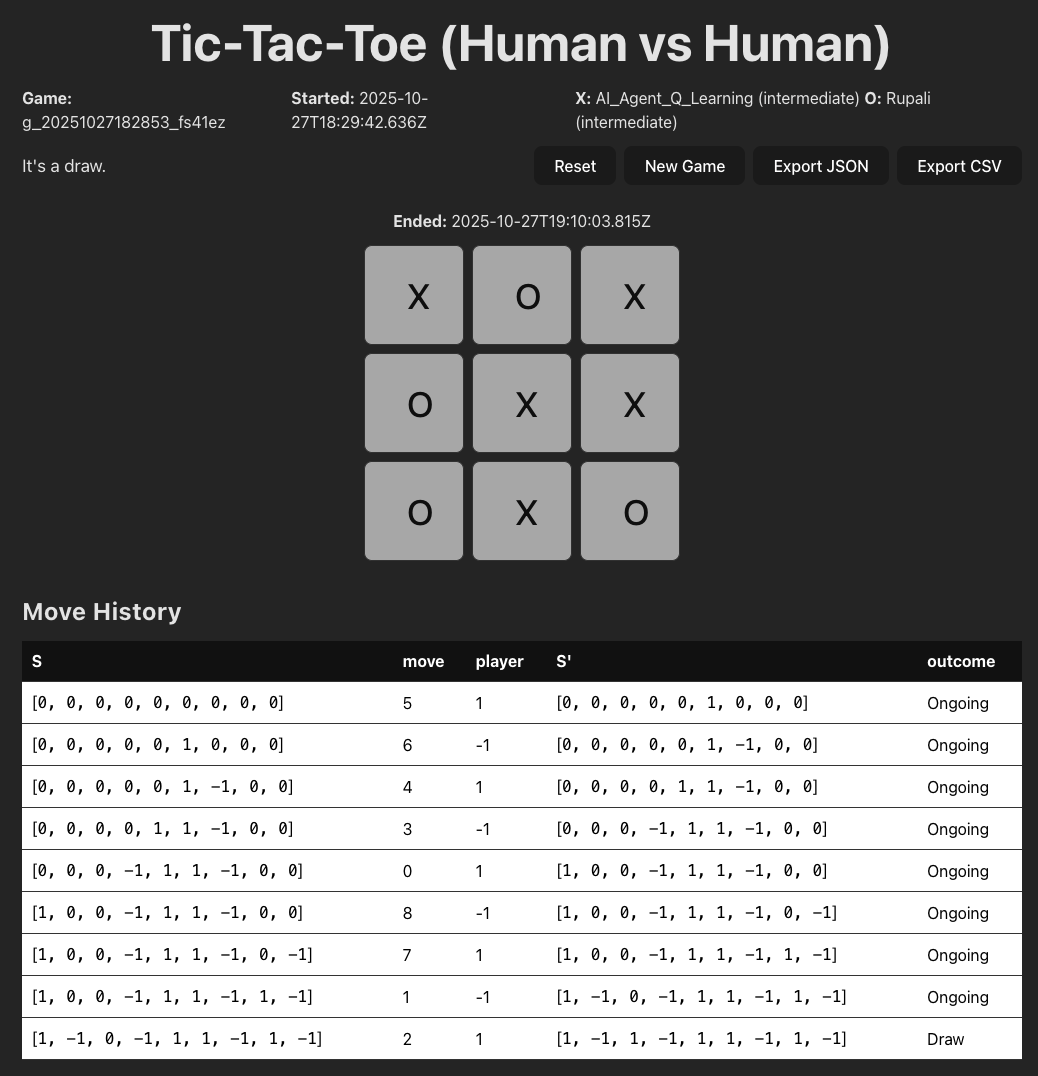
We built a Tic-Tac-Toe website1 to collect data. This website was created using React and TypeScript. Figure 1 shows the user interface of the website. Here, a game ID is generated for each game. Moreover, we ask the players to enter their names and their experience levels. In Figure 2, we show one game. In the top half of the figure, we see the game being played. In the lower half, we show a table preview of the data that we are logging. Each row is a move from a player. The columns of the table indicate the current state of the board as “S", the move played by a player as “move", the player who played this move as “player", the next state of the board as “S", and finally the outcome of the game as “outcome" that can take the values of “win", “loss" or “draw". You may notice that there aren’t any “X’s" and “O’s" in the table. For data analysis purposes, we indicate each place on the board as a number. For example, an X is represented as 1, an empty space is represented as 0, and an O is represented as -1. The move of each player is the number of the cell on the Tic-Tac-Toe board. These numbers begin from the top left corner, starting with 0, and span across each row before moving to the next row. The move history on the interface displays only part of the data that we collected and uploaded to the database.
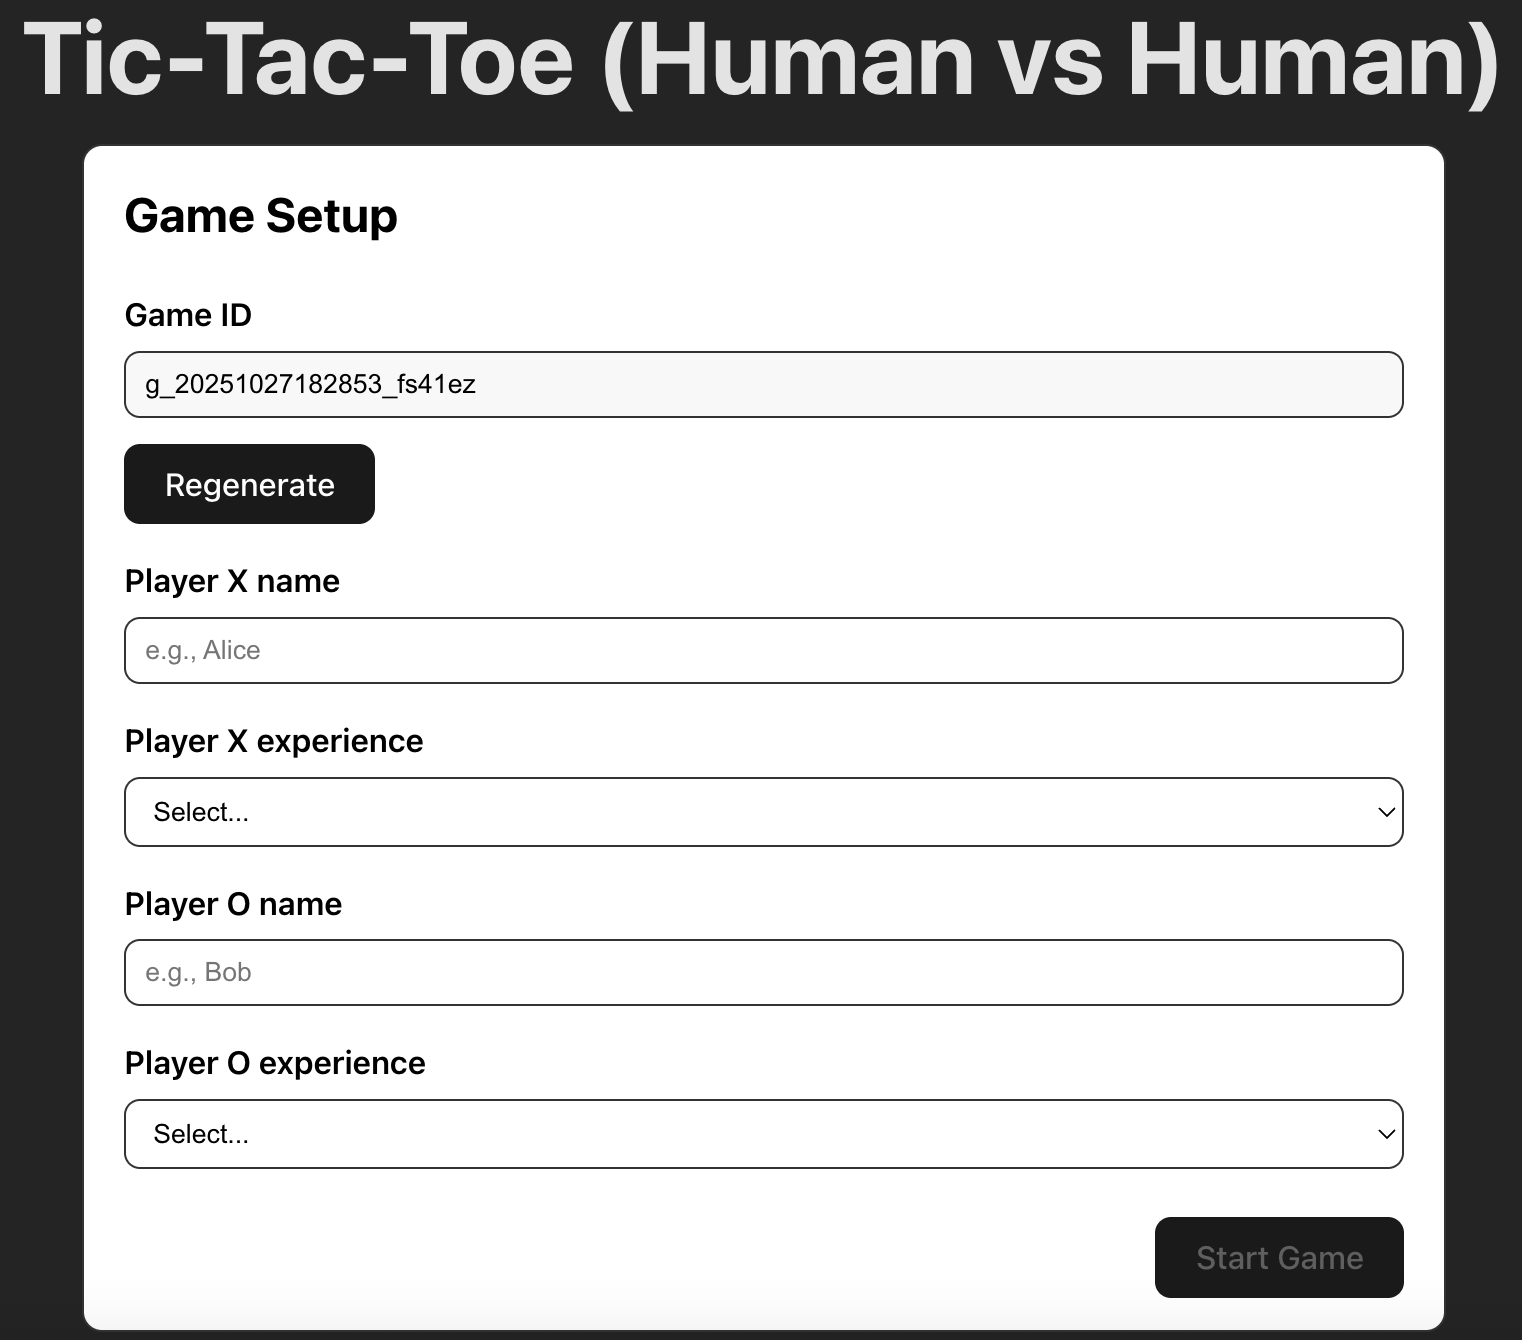
We collected all user data using a Firestore database 2. There are two dataset beings stored: games and moves. The “games” dataset stores all the game information, such as the player name, experience level, and game duration. The “moves” dataset stores all individual moves information, such as the previous and current board state (S and S’ in Fig 2), current move, player, outcome, and game ID that associates the move data to the game data.
In our collected human dataset, the values are primarily quantitative, which include the board states, moves, and players. This is because we transform some categorical values into quantitative values for data analysis purposes. For example, we encode all X moves as 1, O as -1, and the board position from the upper left corner to the lower right corner as 0 to 8. On the other hand, for the values that are associated with the player and game status, the experience level (novice/intermediate/expert) is ordered, and player names and game IDs are nominal.
We did not have too much “dirty” data. However, while testing the interface, we entered some test fields and played some testing games that were also stored in the database. We had to separate these games from the actual player data and make sure that while collecting the data, players were not playing against themselves. To deal with this situation, we added a “submit" button after a game has ended. If a game was played for the testing purposes or if people wanted to play it with themselves for fun, they had the option to not submit the data at the end. In this way, not all moves would be logged automatically. Additionally, an unexpected situation was that the board state data (stored as lists) could be hard to handle in the CSV format. Therefore, we later also recorded the board state as a string (X as ‘1’, O as ‘-1’, empty position as ‘.’).
AI Data
We trained two AI agents:
AI - Agent 1
We trained an agent using the popular reinforcement learning algorithm Q-learning. Q-learning is a model-free method, which makes it especially useful for scaling to games more complex than Tic-Tac-Toe. For our experiments, we set the learning rate to 0.1 and trained the agent for 10,000 episodes to ensure it had sufficient experience to learn effective strategies.
AI - Agent 2
We also trained an agent using a dynamic-programming-based reinforcement learning method called Value Iteration. This approach is simple and interpretable, making it easy to understand how the agent evaluates states and updates its decisions. However, because Value Iteration requires sweeping over the entire state space, it does not scale well to larger or more complex games. In our setup, we used a convergence threshold of 1e-6 and allowed up to 1,000 iterations. This means that the algorithm will train until either the value updates are less than 1e-6 or until 1000 iterations have been reached. This ensures the algorithm reached a stable solution.
Note that for both the AI agents, if there are multiple optimal moves, one of these moves is selected at random and is suggested in the visualisation. Moreover, we wanted to emulate a scenario where the task is complex (more complex than Tic-Tac-Toe), and the AI agents and the humans have diverging opinions. Therefore, we have not trained the AI agents fully because the game of Tic-Tac-Toe is too easy, and the agents will always give similar optimal answers.
Task Analysis
Interview Findings
We interviewed two participants: a reinforcement learning researcher who uses visualizations to study robotics and AI agents, and and experienced board game player with substantial knowledge in strategic board games, such as Chess, Go, and Tic-Tac-Toe. We learned that both participants were interested in comparing different AI strategies. P2-player wanted to view AI decisions to compare their differences and similarities, while P1-researcher wanted to know the state in which AI algorithms diverge and disagree the most.
Both participants also showed interest in viewing a sequence of board game states, which is how players make step-by-step moves. This would help them learn about game-play strategies at a particular game state. P1-researcher would want to further identify how optimal a move was, the moment when the game went wrong, and the percentage of players following optimal strategies. Similarly, the P2-player would like to know the win rates of game moves to learn about the best decisions.
Domain Task Analysis
We conducted affinity diagramming and abstracted the domain tasks following Brehmer & Munzner’s typology. We further ranked the task priority by their levels of importance. The task analysis results are represented in the Table below.
We focused on three core tasks: for each move on the board, viewing the next move recommendations made by different AI agents or the most frequent next move made by human players. This is because both stakeholders (player and researcher) indicated interest in viewing how AI agents play the game and comparing the decisions between different AI agents (Task 1, 3). To complement the AI data, we collect some human decisions to reveal how human players play the game (Task 2). We decided to assign a lower task priority to each move’s win rate, because computing win rates from the data we collected (with a small sample size) could be inaccurate, while showing the most frequent human next move would be more understandable and feasible based on our datasets.
| Domain Task | Abstraction | Task Level | Stakeholder | Priority | |
|---|---|---|---|---|---|
| 1 | View move recommendations made by different AI agents | Analyze, consume, discover | High Level | Both | Most important |
| 2 | Know the most frequent next moves made by human players | Query, compare | Low Level | Player | Most important |
| 3 | Know the distribution of AI’s next move probabilities | Query, summarize | Low Level | Both | Most important |
| 4 | Identify the win rate or optimality of a move | Analyze, consume, discover | High Level | Both | Medium important |
| 5 | Find the percentage of people playing optimal strategies | Query, summarize | Low Level | Researcher | Least important |
| 6 | Investigate the first-move advantage | Analyze, produce, derive | High Level | Researcher | Least important |
Design Process
Design Sketches
We sketched our interface based on the interview findings and domain task analysis. In Figure 3, the left section is the game being played, and the right section is a visualization board showing recommended moves by AI agent 1 (AI-1) in blue, AI agent 2 (AI-2) in green, and Human in red. The two AI agents are two different algorithms recommending their best move. The Human move is the most common move taken by humans based on our collected data. This visualization provides an overview of human and AI strategies at a board state.
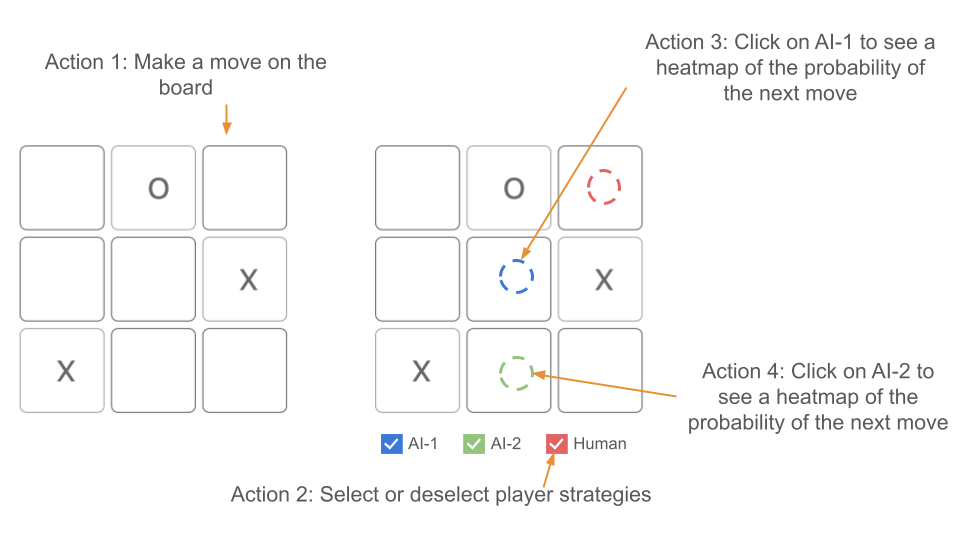
As shown in Figure 3, there are four interactive actions that a user can take from this screen:
-
Action 1: Make a move on the board When a player makes a move on the board, the visualization changes as shown in Figure 4. Note that the recommendation board is linked to the game and also changes. In this case, the AI-1 and the Human are recommending the same move. We chose to display human or AI suggested moves on a board in parallel so users could easily view the next possible actions. By showing different recommendations on the same board, the visualization also supports comparison between human/AI or AI/AI strategies.
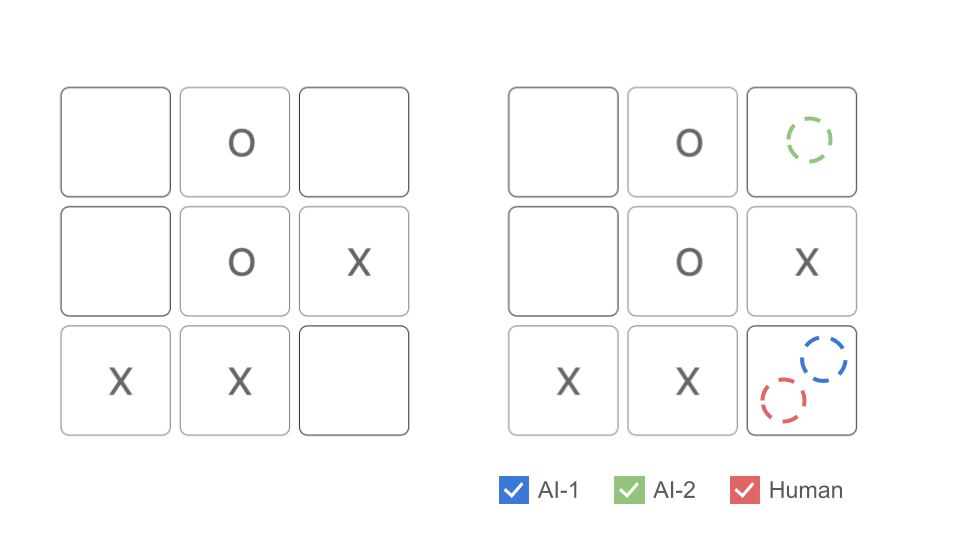
Figure 4: Action 1: Make a move on the board. -
Action 2: Select or deselect player strategies The player can select or deselect which recommendations they want to see. For example, if the player only wants to see the recommendations from the Human, they may deselect AI-1 and AI-2 as shown in Figure 5. We chose to use the filtering technique to enable the player to customize particular combination of recommendations that they want. For example, selecting AI-1 and AI-2 together to compare AI strategies or selecting AI-1 and human to compare the decisions between human players and AI-1.
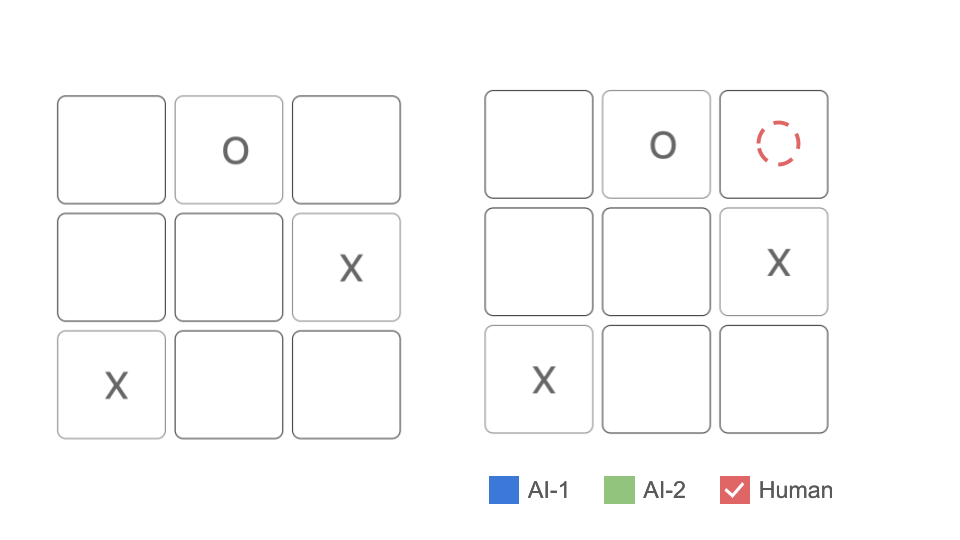
Figure 5: Action 2: Select or deselect player strategies. -
Action 3: Click on AI-1 to see a heatmap of the probability of the next move When a player clicks on AI-1 on the recommendation board, a heatmap of AI-1’s probability of the next move will appear on the screen as shown in Figure 6. We chose to use details-on-demand technique to avoid overloading players while helping a player understand the distribution of AI suggested moves.
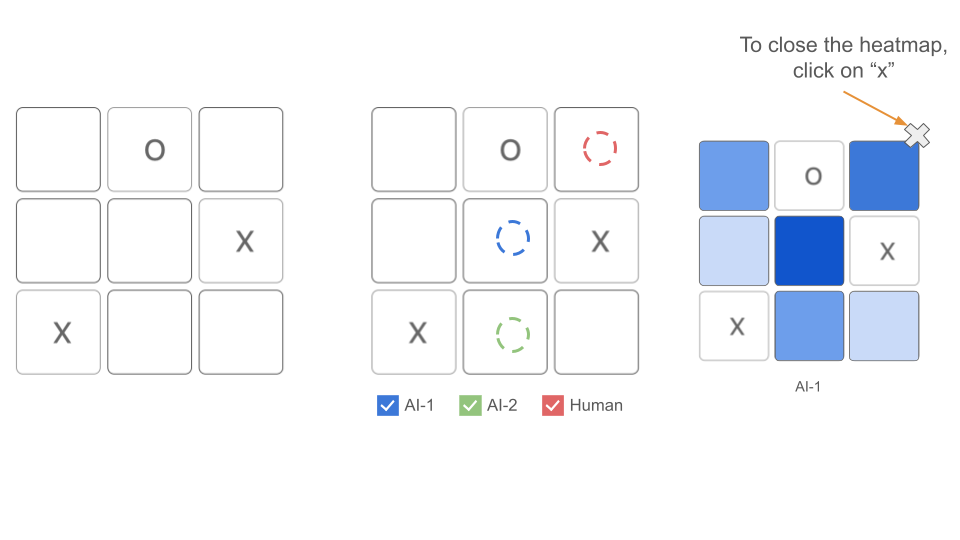
Figure 6: Action 3: Click on AI-1 to see a heatmap of the probability of the next move. -
Action 4: Click on AI-2 to see a heatmap of the probability of the next move Similar to action 3, when a player clicks on AI-2 on the recommendation board, a heatmap of AI-2’s probability of the next move will appear on the screen as shown in Figure 7. We keep actions 3 and 4 separate to not overwhelm the player with too much information.
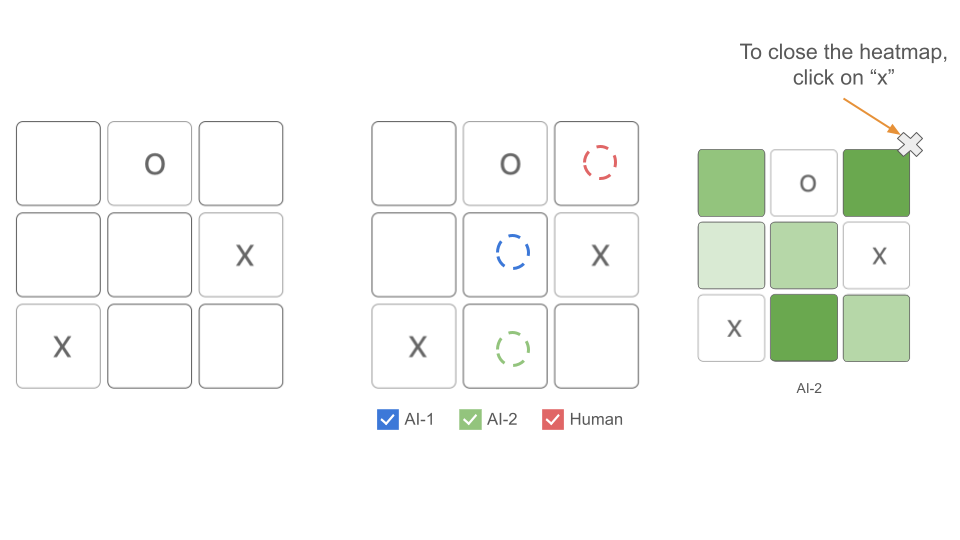
Figure 7: Action 4: Click on AI-2 to see a heatmap of the probability of the next move.
Usability Testing
After creating the initial design sketches, we conducted our usability testing sessions with 4 students. We first asked the participant to play a game of Tic-Tac-Toe and then use our visualization tool to review the game that they played. They were also encouraged to explore on the interface, including the feature that selects different player strategies and displays AI heatmaps. Here are some high-level notes and trends that we observed during the testing sessions:
-
Unaware of the heatmap interaction: None of our participants noticed our heatmap interaction, even though we included a little hint below our visualization. Participants suggested placing heatmap hints anywhere else to make it more visible, adding an info icon next to the visualization header, or adding a short, animated gif when the user first opens the visualization website (suggested by our professor).
-
Unclear information about AI algorithms: Three of our participants showed interest in learning more about the AI algorithms that we used and why they could make different choices at some board configurations. Instead of encapsulating all the information in “AI1, AI2,” P3 would like to get more information on which models we used, which parameters we set, and any other essential information that impacted the model performance. P2, P3, and P4 were confused about why the probabilities on the board cells had very close data (e.g., 0.14, 0.13) instead of having one move with significantly higher probability. P4 commented that when there was only one correct answer that led to success, the probability was still only off by 0.1. It would be helpful to have more distinctive probabilities, and one AI to be stronger, and another one could be a little weaker.
-
Refinement on the visualization interface: All Participants commented that our interface was fun, enjoyable, and simple. Still, they provided different comments on the future iteration of our interface. P2 and P4 wanted a different visualization when two AI decisions collided (e.g., alternating color, two symbols in the same cell). Both P3 and P4 pointed out that having the grid lines in the heatmap could be helpful for understanding.
We have addressed these concerns in the final visualization explained below.
Final Visualization
Visual Encoding
We applied the following visual encoding techniques to create our visualization. First, we used color-coding for each game-play strategy, including human, AI-1, and AI-2. This supports easy mapping and differentiation between different strategies when users view the board. The colors are based on the Tableau color palette, but we chose three colors with enough contrast and avoided colors with existing connotations, such as red and green, to reduce the bias of indicating a move as the better or worse strategy. Next, we adopted linking between the left board (game play) and the right board (recommendation visualization) so the visualization will be updated in real-time while players are making a new move. Also, the strategies on the recommendation visualization could be filtered by selecting or de-selecting the checkbox. This supports the flexibility of only viewing AI-moves while comparing AI strategies or viewing human and AI’s moves while comparing human/AI strategies. Lastly, upon clicking the suggested AI move on the right board, users could view a probability heatmap that includes the distribution of probability among all the allowed positions on the board. We used a detail-on-demand technique to avoid overloading users and prioritized a single suggested move for AI, leaving the probability details available only upon request.
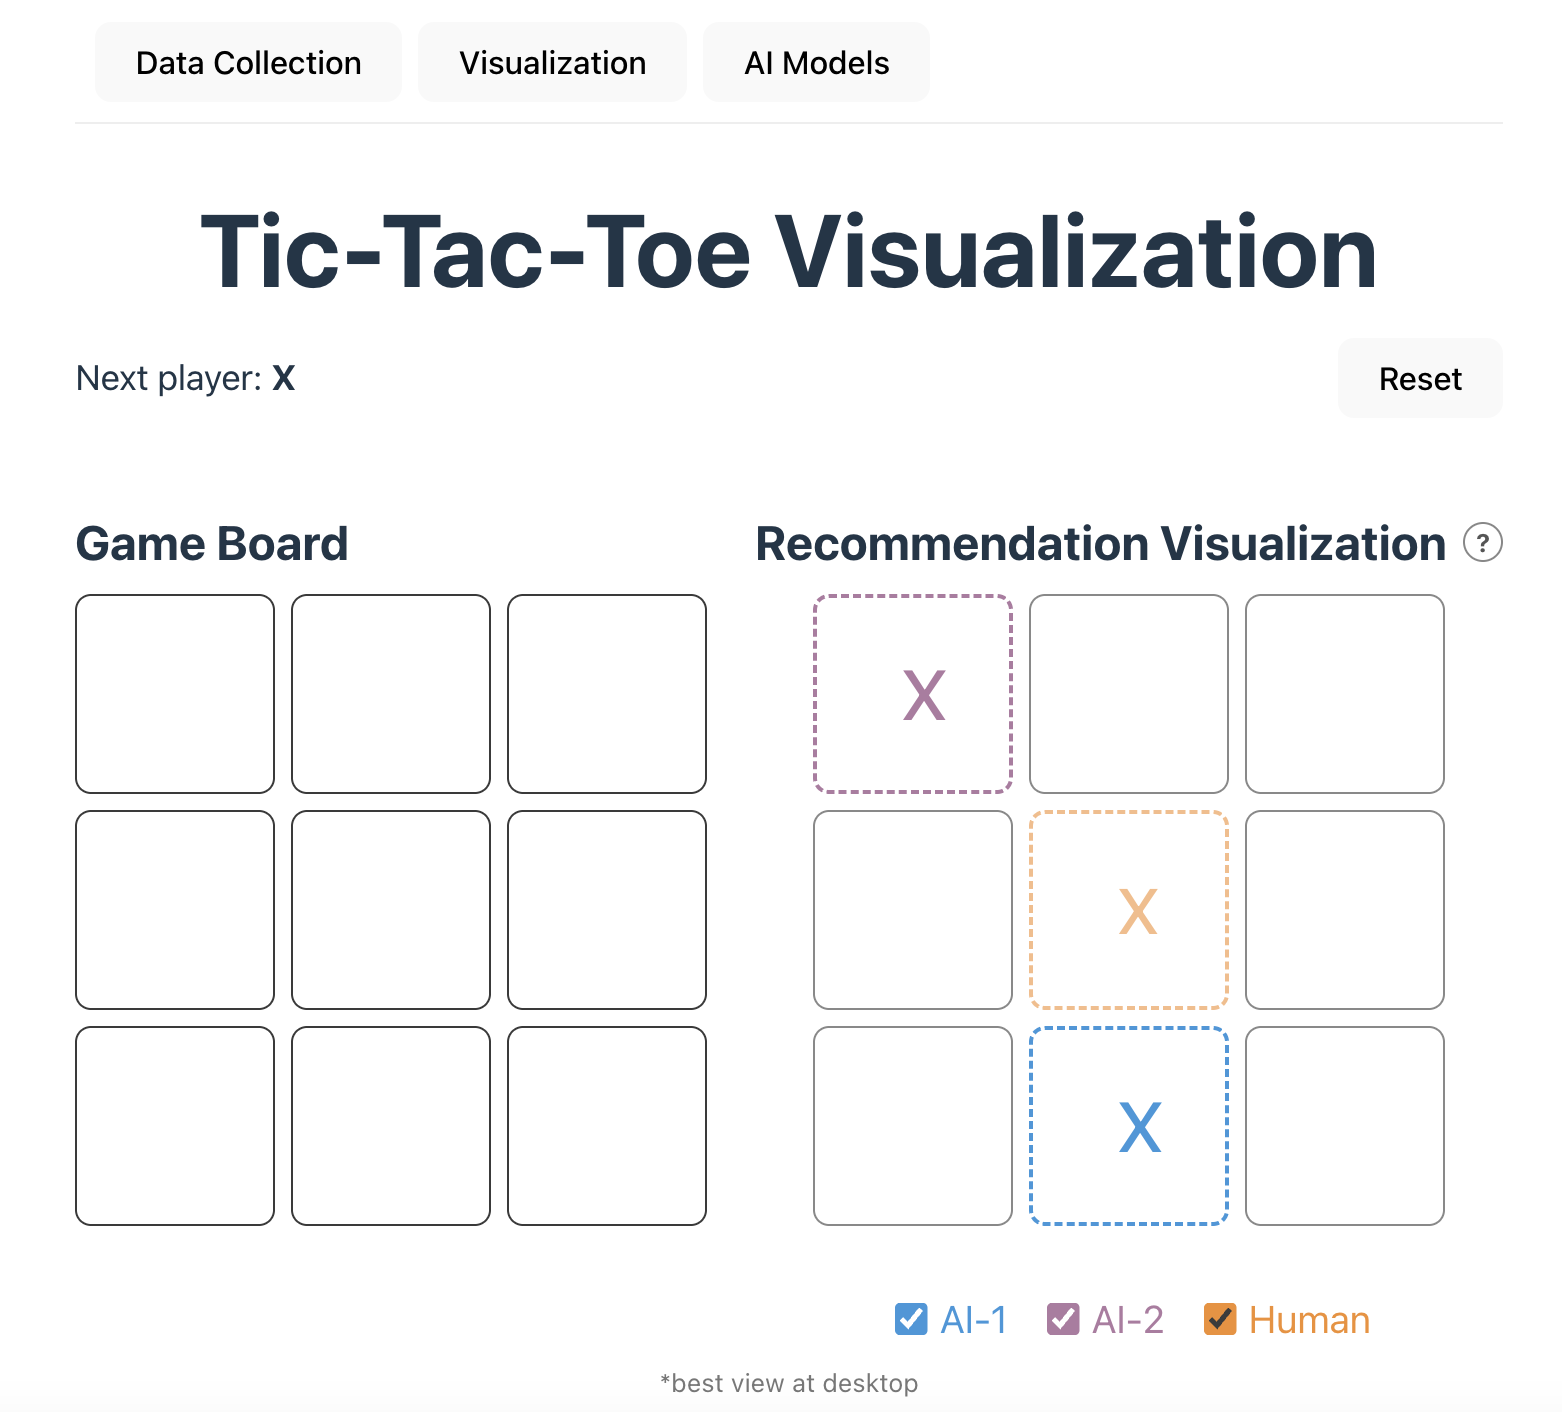
User Interface
In our visualization, there are two boards as shown in Figure 8. On the left side is the Game Board where the game is being played. On the right side is the Recommendation Visualization, which shows the recommendations of the two AI agents and the most probable human move. On the top of the webpage, there are separate tabs for Data Collection, Visualisation and AI Models. The Data Collection tab is used to enter the information of the players when they are playing a game that should be added to the human dataset. The Visualisation tab is shown in Figure 8. Lastly, the AI models tab share the details of the AI models (AI-1 and AI-2) that are used in the recommendation visualization.
We have implemented the following interactive actions:
-
Action 1: Make a move on the board. A player can make a move on the game board (see Figure 8) by clicking on the cell where they want to play
-
Action 2: Select or deselect player strategies. We implemented the functionality to select and deselect player strategies. In Figure 9, we have selected the AI-1 and AI-2 strategy strategy, while we have deselected the Human strategy.
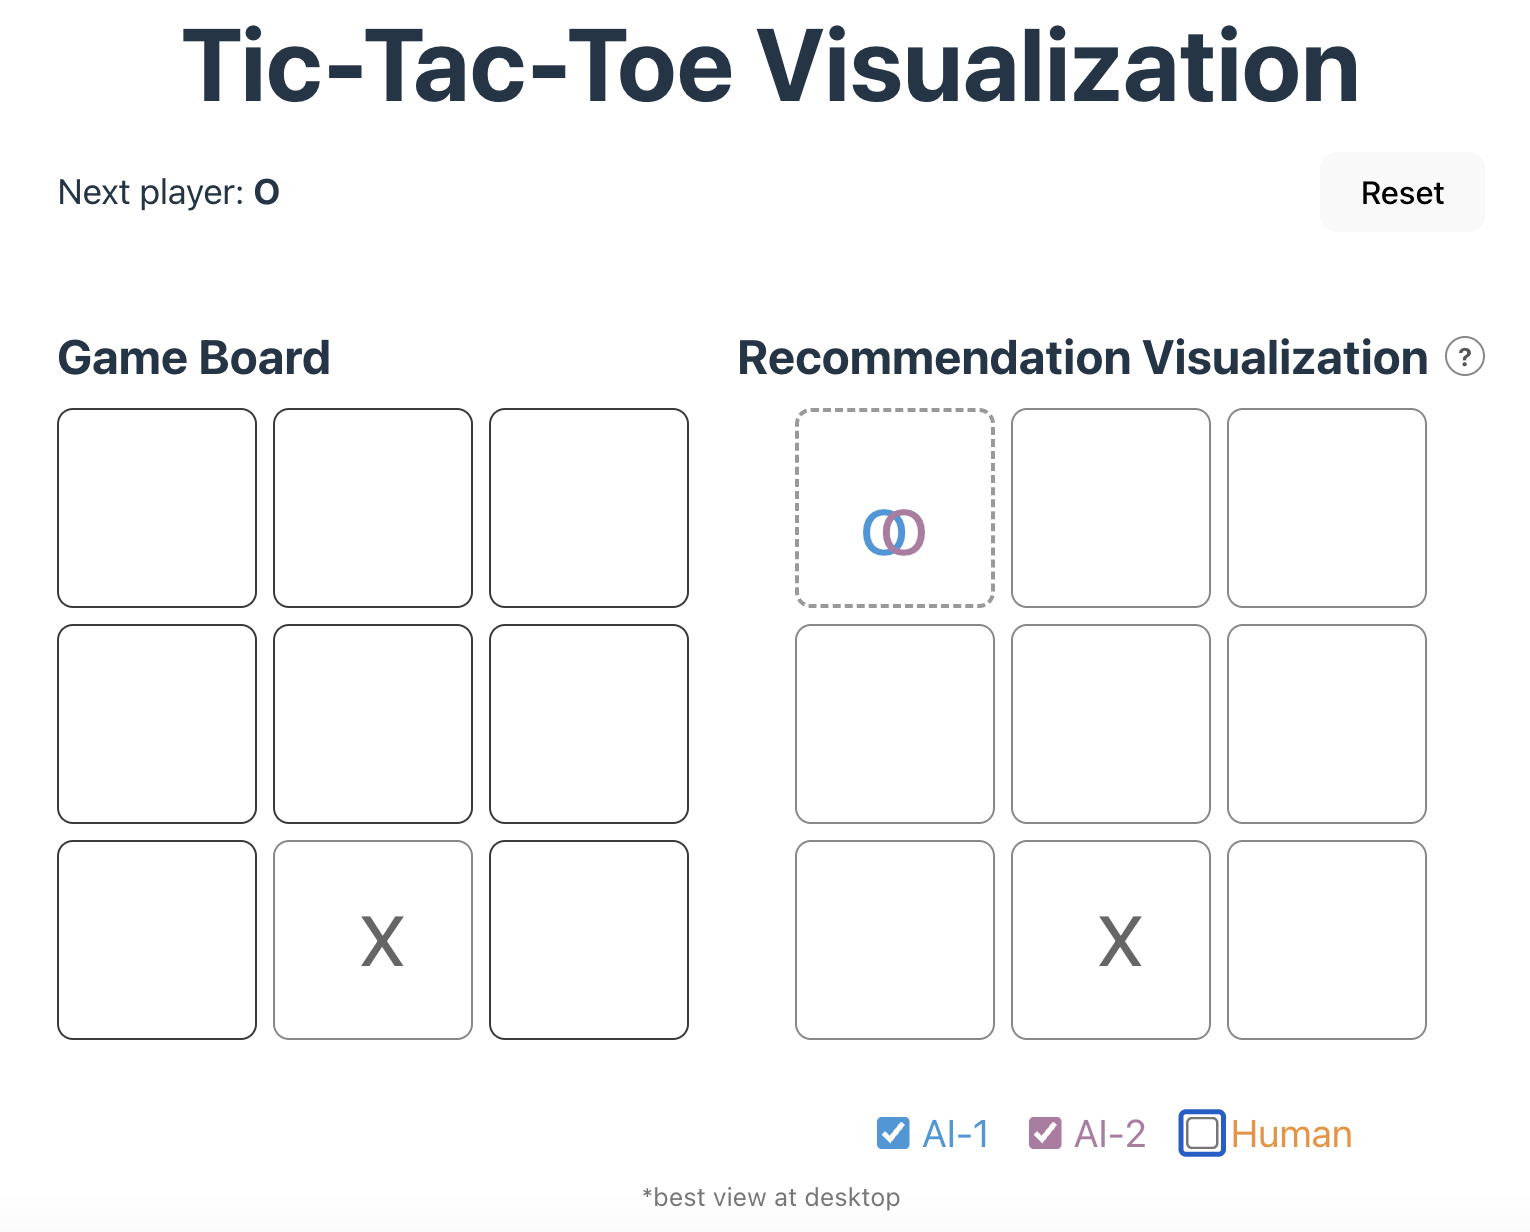
Figure 9: Users can select or deselection the player strategies using the checkbox. In the figure, when strategies overlap, we use a Venn Diagram to represent them in the same cell. -
Action 3: Click on AI-1 or AI-2 to see a heatmap of the probability of the next move. When the user clicks on a recommendation in the Recommendation Visualization board, a heatmap will pop up as shown in Figure 10 and Figure 11. The heatmap shows the probabilities of each move recommended by the AI agent. Hovering over the heatmap will display a detailed probability that the position has as shown in Figure 11. We have updated the heatmap from the design sketches to authentically represent the difference in the probabilities of moves and emphasize the color contrast for users to be able to differentiate the moves in the heatmap.
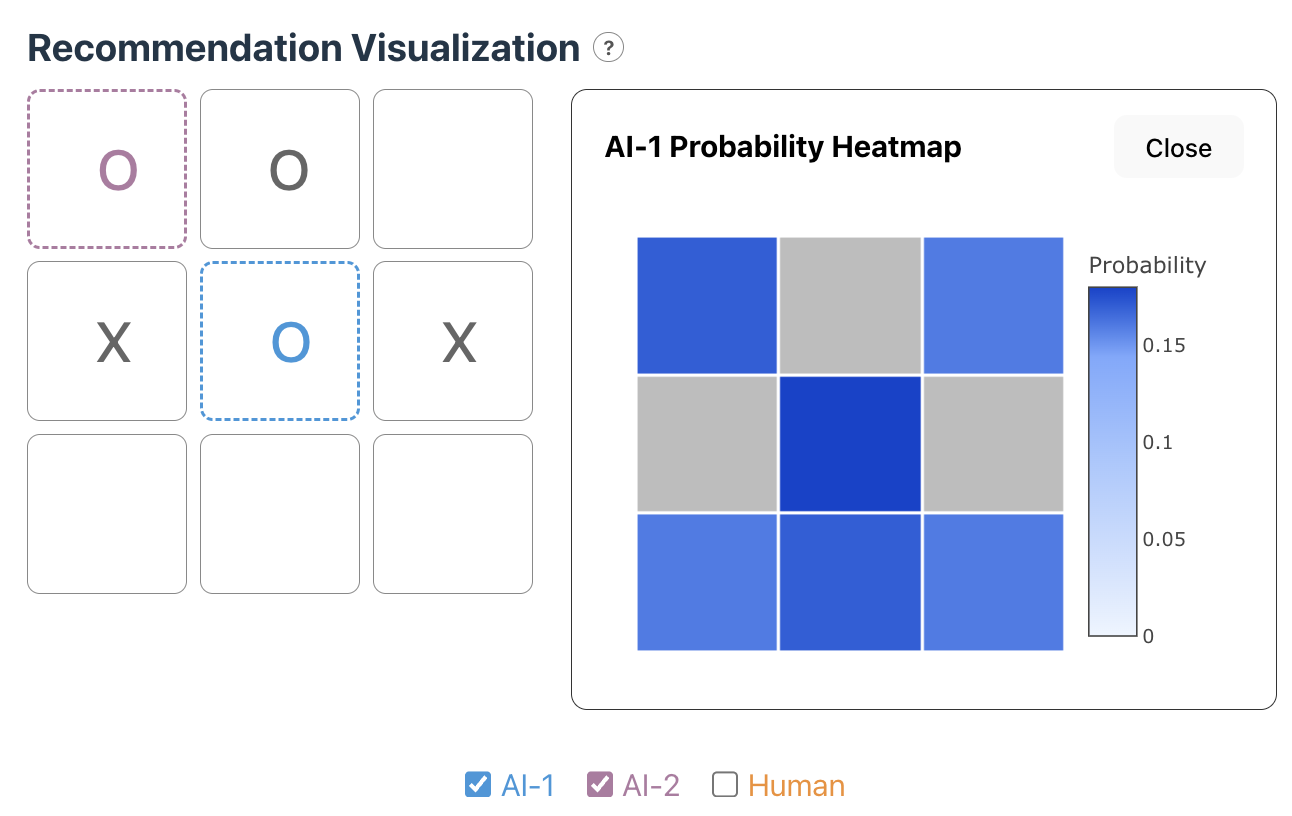
Figure 10: The probability heatmap of AI-1 which indicates the middle position at the move with highest probability. 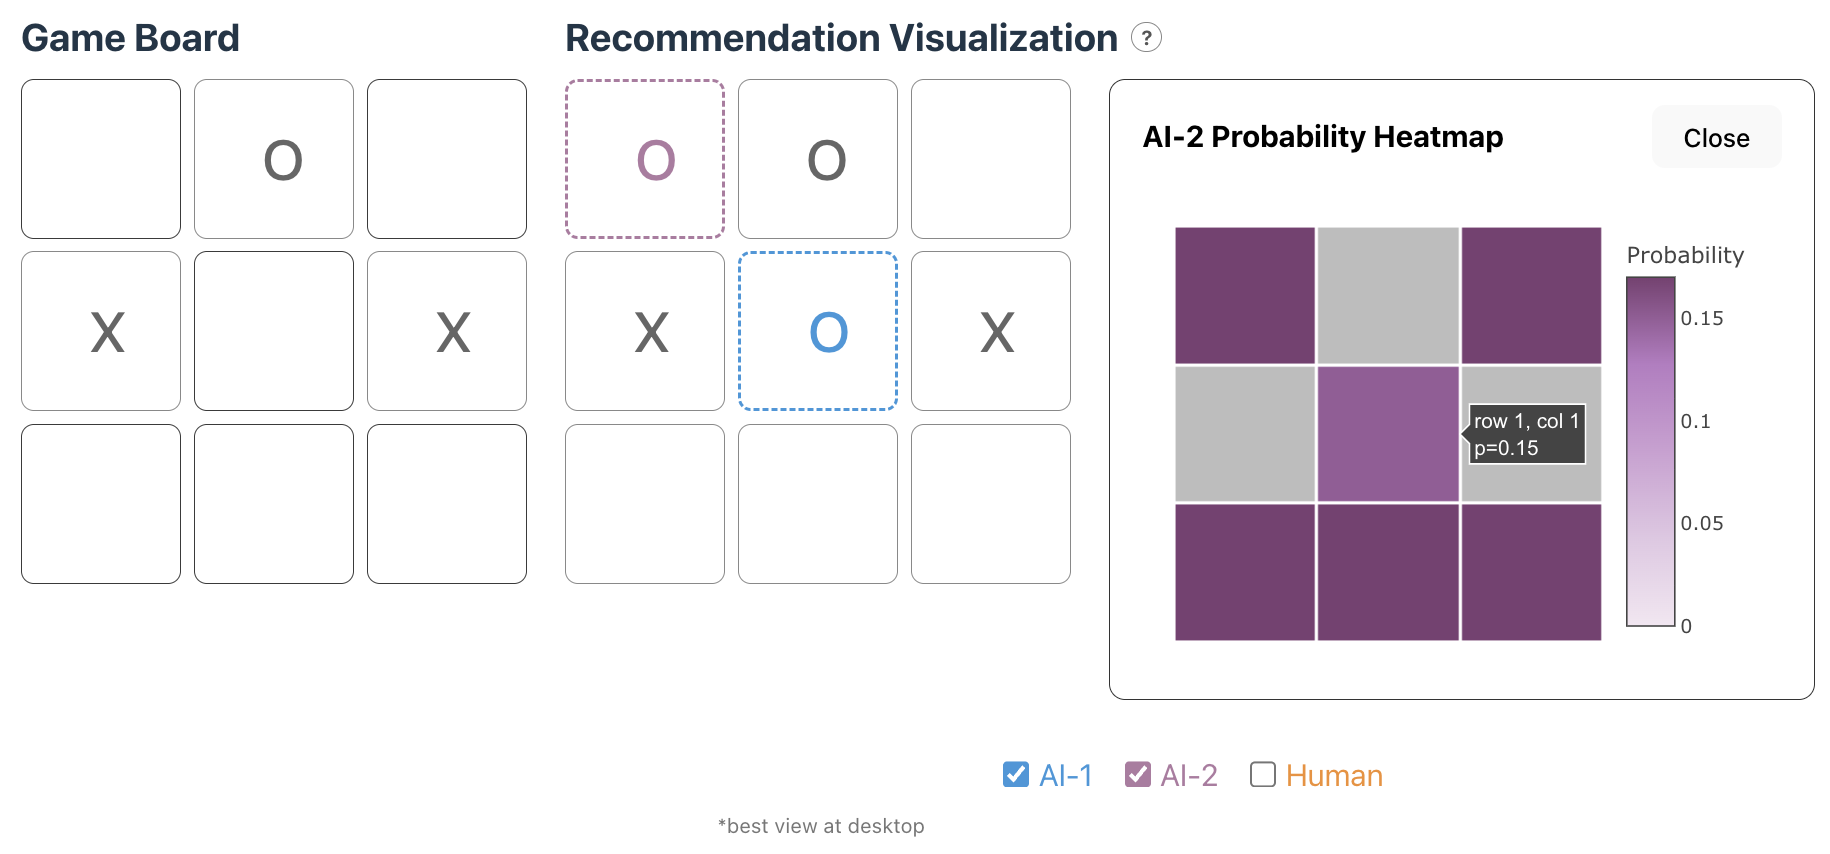
Figure 11: The probability heatmap of AI-2 which indicates the middle position at the move with least probability. It indicates that AI-2 has worse performance than AI-1.
In addition, the interface includes an information icon next to the Recommendation Visualisation that reminds users about the probability heatmap interaction.
Implementation
For the implementation of our visualization, we implemented the game board using React and TypeScript. Users can interact with the board and view real-time visualizations. To display the AI recommendations and the most frequent human moves, we used React and TypeScript to add shapes onto the game board. To generate visualizations for the probabilities of AI’s next moves (heatmap), we used Plotly 3.
Data Analysis
Our preliminary findings highlight several interesting patterns across both AI and human gameplay. First, from our human gameplay data, we observed that players who take the first turn (X) overwhelmingly prefer opening in the center position (position 4). We also noticed a consistent strategic trend: if the O player fails to play a corner move (positions 0, 2, 6, or 8) on their first turn, they are likely to lose the game assuming X plays optimally afterward. This suggests that early-game decisions, especially for O, heavily influence the outcome in human play. Collecting more human data will be valuable to have a better estimate of human moves.
For the AI agents, due to the way our agents were trained—and because many Tic-Tac-Toe board states are isomorphic—the probabilities assigned to different moves often appear close in value. Training the AI agents for more episodes, or modifying the game to include states with more clearly optimal moves, would likely lead to a wider separation in predicted probabilities and more distinct heatmaps. Additionally, the algorithms used in this study are not designed to maximize probability gaps between moves. As long as the optimal move receives the highest expected reward, the agents consider the policy sufficiently good, even if alternative moves have nearly similar probabilities. When comparing the two AI systems, AI-1 consistently demonstrated stronger and more confident decision-making than AI-2. These performances can vary depending on how much we train each agent.
Conclusion
We designed and built an exploratory visualization tool to help game players and researchers investigate Tic-Tac-Toe strategies used by humans and various AI models. Looking ahead, there are several directions for future work, including personalizing visualizations based on a player’s game history, collecting more human gameplay data, and examining additional AI models or variations of the current ones. We also aim to expand the tool to support a wider range of board games, strengthen the AI agents themselves, and explore more complex gaming environments. With more data, we plan to add features such as a timeline-style sketch that illustrates how each game unfolds, giving users an even clearer understanding of strategic dynamics. This will allow a user to analyse their own moves and compare them to the AI models or the most probable human moves.